What’s WASAVIES
WASAVIES represents “WArning System for AVIation Exposure to Solar energetic particle”. It calculates the radiation dose rates due to cosmic-ray exposure anywhere in the atmosphere in real time, and issues an alert when a sudden increase of the dose rates is detected due to the occurrence of large solar flare. It was developed by National Institute of Information and Communications Technology (NICT), Japan Atomic Energy Agency (JAEA), National Institute of Polar Research (NIPR), Hiroshima University, National Institute of Technology Ibaraki College, and Nagoya University under the framework of Project for Solar-Terrestrial Environment Prediction (PSTEP).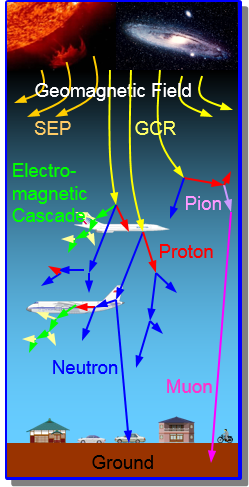
Figure 1: Schematic view of the atmospheric propagation of cosmic-ray
Background
Aircrews are subjected to be exposed to enhanced level of radiation doses due to cosmic-ray exposure (see Fig. 1). As a result of the release of International Commission on Radiological Protection (ICRP) Publication 60 in which the aircrew exposure is recognized as occupational hazard, many countries have issued regulations (or recommendations) setting an annual dose limitation for aircrews. Development of a tool to estimate the aircrew doses is indispensable for keeping the regulations.
Two sources must be considered in the dose estimation, which are galactic cosmic-ray (GCR) and solar energetic particle (SEP). GCR are continuously incident to the atmosphere, and they are the main course of the cosmic-ray exposure during solar quiet period. Their radiation dose rates gradually vary with the 11-year solar cycle, and several tools such as JISCARD were developed for the post-exposure evaluation of the aircrew doses. On the contrary, SEP are incident to the atmosphere only when a large solar flare occurs, but their radiation dose rates occasionally become much higher than those of GCR – more than 2 orders of magnitude.
ICAO concerns an increasing radiation exposure by cosmic rays as well as a disruption of HF communication and increasing an error of GNSS measurement caused mainly by solar activities, therefore, ICAO requires information on radiation dose by cosmic rays as space weather information. In ICAO, a radiation advisory will be issued when an estimated radiation dose rate is expected to exceed the defined thresholds (Table 1).
Thus, it was desirable to develop a tool for estimating the SEP dose rates in the atmosphere in real time.
Table 1 ICAO radiation advisory thresholds
| STATUS | Condition |
|---|---|
| Moderate | 30μSv/h at 25,000ft-46,000ft |
| Severe | 80μSv/h at 25,000ft-60,000ft |
Calculation Procedures of WASAVIES
We therefore developed a physics-based model for SEP dose estimation anywhere in the atmosphere and designated it WASAVIES: WArning System for AVIation Exposure to Solar energetic particles. When high-energy SEP are incident on the atmosphere, they induce extensive air-shower (EAS) by producing various secondary particles, such as neutrons, and increase the count rates of neutron monitors (NM) at the ground level. This phenomenon is called ground level enhancement (GLE). WASAVIES automatically detects the occurrence of GLE, and updates the radiation dose rates at intervals of 5 min. Except during GLE, WASAVIES outputs daily GCR dose rates calculated by EXPACS using Force Field Potential (FFP). Figure 2 shows a flowchart of the calculation procedures of WASAVIES. In the system, the profiles of each GLE are characterized by four parameters, namely, injection profile (IP), power index γ of the primary SEP around the Sun, north-south tilt angle of ambient magnetic field incident to the magnetosphere θt, and normalization coefficient of the SEP fluence N0. These parameters are determined automatically from the count rates of 12 selected NMs at the ground level and the proton flux measured by the GOES satellite, which are downloaded continuously at intervals of 5 min from the Neutron Monitor Database NMDB and the Space Weather Prediction Center of NOAA, respectively. Four databases such as the response function of the EAS simulation performed by PHITS must prepared before executing the real-time and automatic analysis program of WASAVIES. In this calculation, the geomagnetic activity is characterized based on the real time Kp index.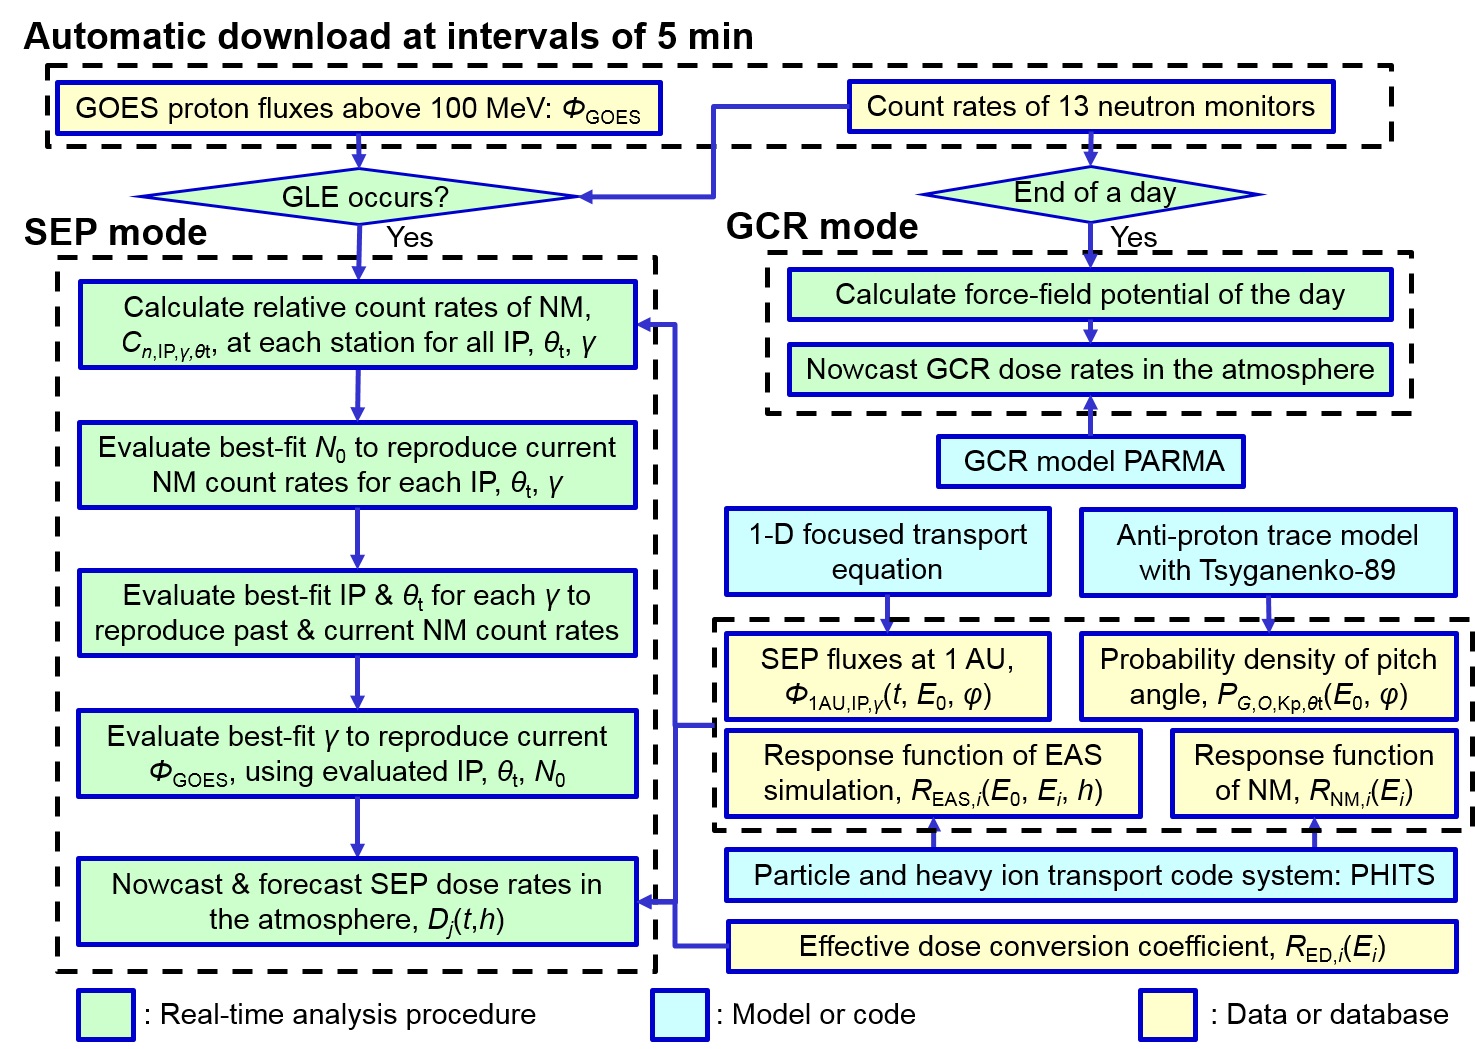
Figure 2: Flowchart of calculation procedures of WASAVIES
Sample Outputs
Figures 3 and 4 show the worldwide dose rate map at 12 km and route-dose rate map between Tokyo and London, respectively, during GLE 69 (7:00 UT, Jan 20, 2005) drawn using WASAVIES. The complicated latitude, longitude, and altitude dependences of the dose rates such as the southern asymmetry can be seen in these figures, owing to the sophisticated physics models implemented in WASAVIES. The details of the calculation procedures of WASAVIES together with its validation results are given in our papers (see Reference page). A demonstration of WASAVIES when a GLE occurrs is available.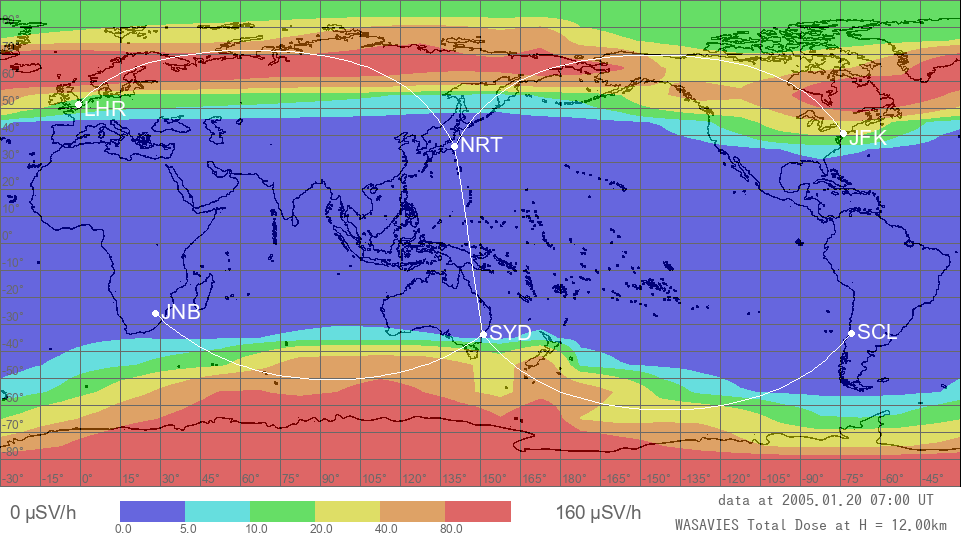
Figure 3: Worldwide map of calculated dose rate during GLE69 (7:00 UT, Jan. 20, 2005) drawn using WASAVIES
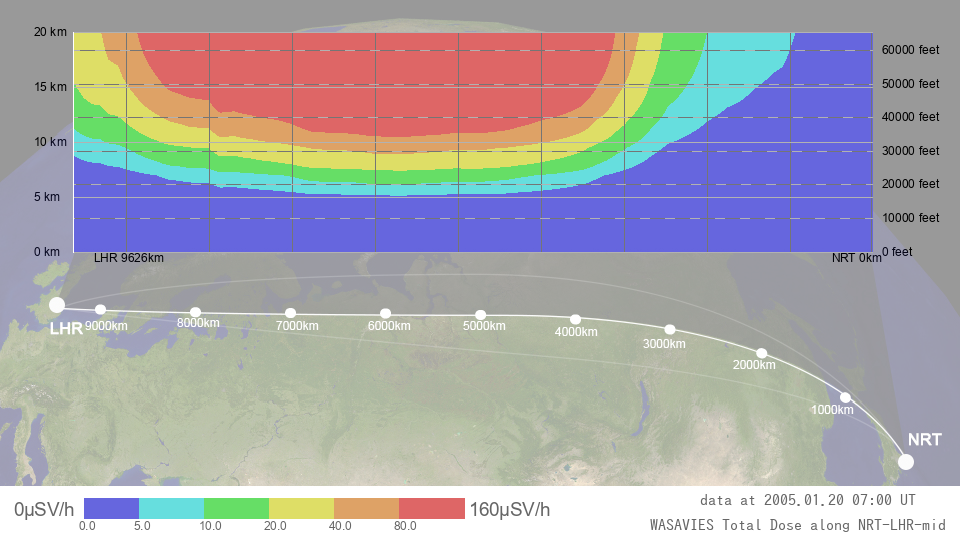
Figure 4: Contour map of calculated dose rates over middle route between Tokyo and London during GLE69 (7:00 UT, Jan. 20, 2005) drawn using WASAVIES
ICAO Threshold Map
ICAO issues advisories on space radiation exposure with thresholds. ACFJ (Australia, Canada, France, Japan) consortium , NOAA SWPC (United States), PECASUS (European consortium), and CRC (China Russia Consortium) have created space radiation threshold maps for each.
The display grid is separated by 15 degree longitude and 30 degree latitude. When the value exceeds 80 μSv/h at FL250 to FL600, it is shown in red; when the value exceeds 30 μSv/h at FL250 to FL460, it is shown in yellow; otherwise, it is shown in light blue.
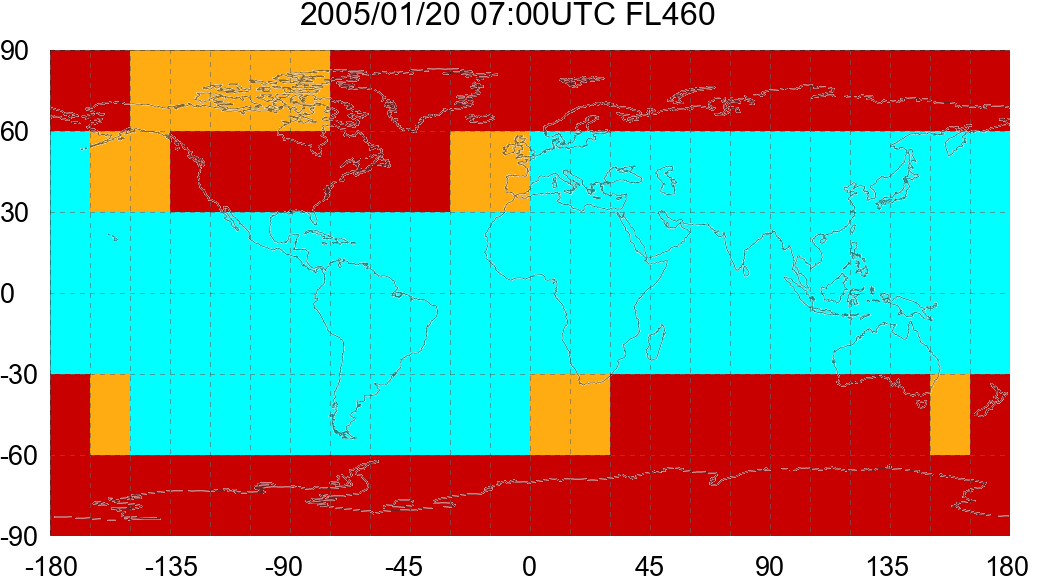
Figure 5: ICAO threshold map. World dose rate map adopted to the format used in the ICAO advisory.
D-index
WASAIVES can draw dose-level maps expressed not only in effective dose rates but also in D-index. Table 1 summarizes the classification of D-index. More detailed information on D-index is described in Meier et al.
Table 2 Classification of D-index taken from Meier et al. 2018
| D-index | Classification | Dose rate interval (uSv/h) | Additional radiation exposure is comparable with |
|---|---|---|---|
| D0 | Quiet | E <5 | Variation of the natural background at cruising altitudes |
| D1 | Nominal | 5 ≤ E < 10 | Natural background at high latitudes up to FL400 |
| D2 | Minor | 10 ≤ E < 20 | Natural background at high latitudes between about FL400 and FL600 |
| D3 | Moderate | 20 ≤ E < 40 | Average dose rate inside the International Space Station (ISS) |
| D4 | Strong | 40 ≤ E < 80 | Average dose rate during an extra-vehicular activity (EVA) on the ISS |
| D5 | Severe | 80 ≤ E | Dose of a North Atlantic return flight per hour, or more |
Development Team of WASAVIES
| T. Sato | JAEA (Japan Atomic Energy Agency) |
| D. Shiota, Y. Kubo, M. Ishii, N. Nishizuka | NICT |
| R. Kataoka | NIPR (National Institute of Polar Research) |
| H. Yasuda | Hiroshima Univ. |
| S. Miyake | National Institute of Technology, Ibaraki College |
| InChun Park, Y. Miyoshi | Nagoya Univ. |